

Overview
Conversational AI Analytics
Designing a conversational analytics experience for Zoovu's enterprise customers and giving teams instant access to performance data through natural language, charts, and a customizable dashboard.
Role
Sole Product Designer
Skills
Figma
Product Design
Prototyping
Stakeholders
Product Manager
Development Team
Status
Shipped
Challenges

No Fast Path to Insight
Getting answers from data meant exporting, manual analysis, and waiting on colleagues. Even for simple questions.

Static Reports
Existing dashboards weren't built for exploration. Users couldn't drill down, compare, or ask follow-up questions.

High Dependency
Non-technical users had no way to self-serve. Every data question required someone else's time.
Opportunity
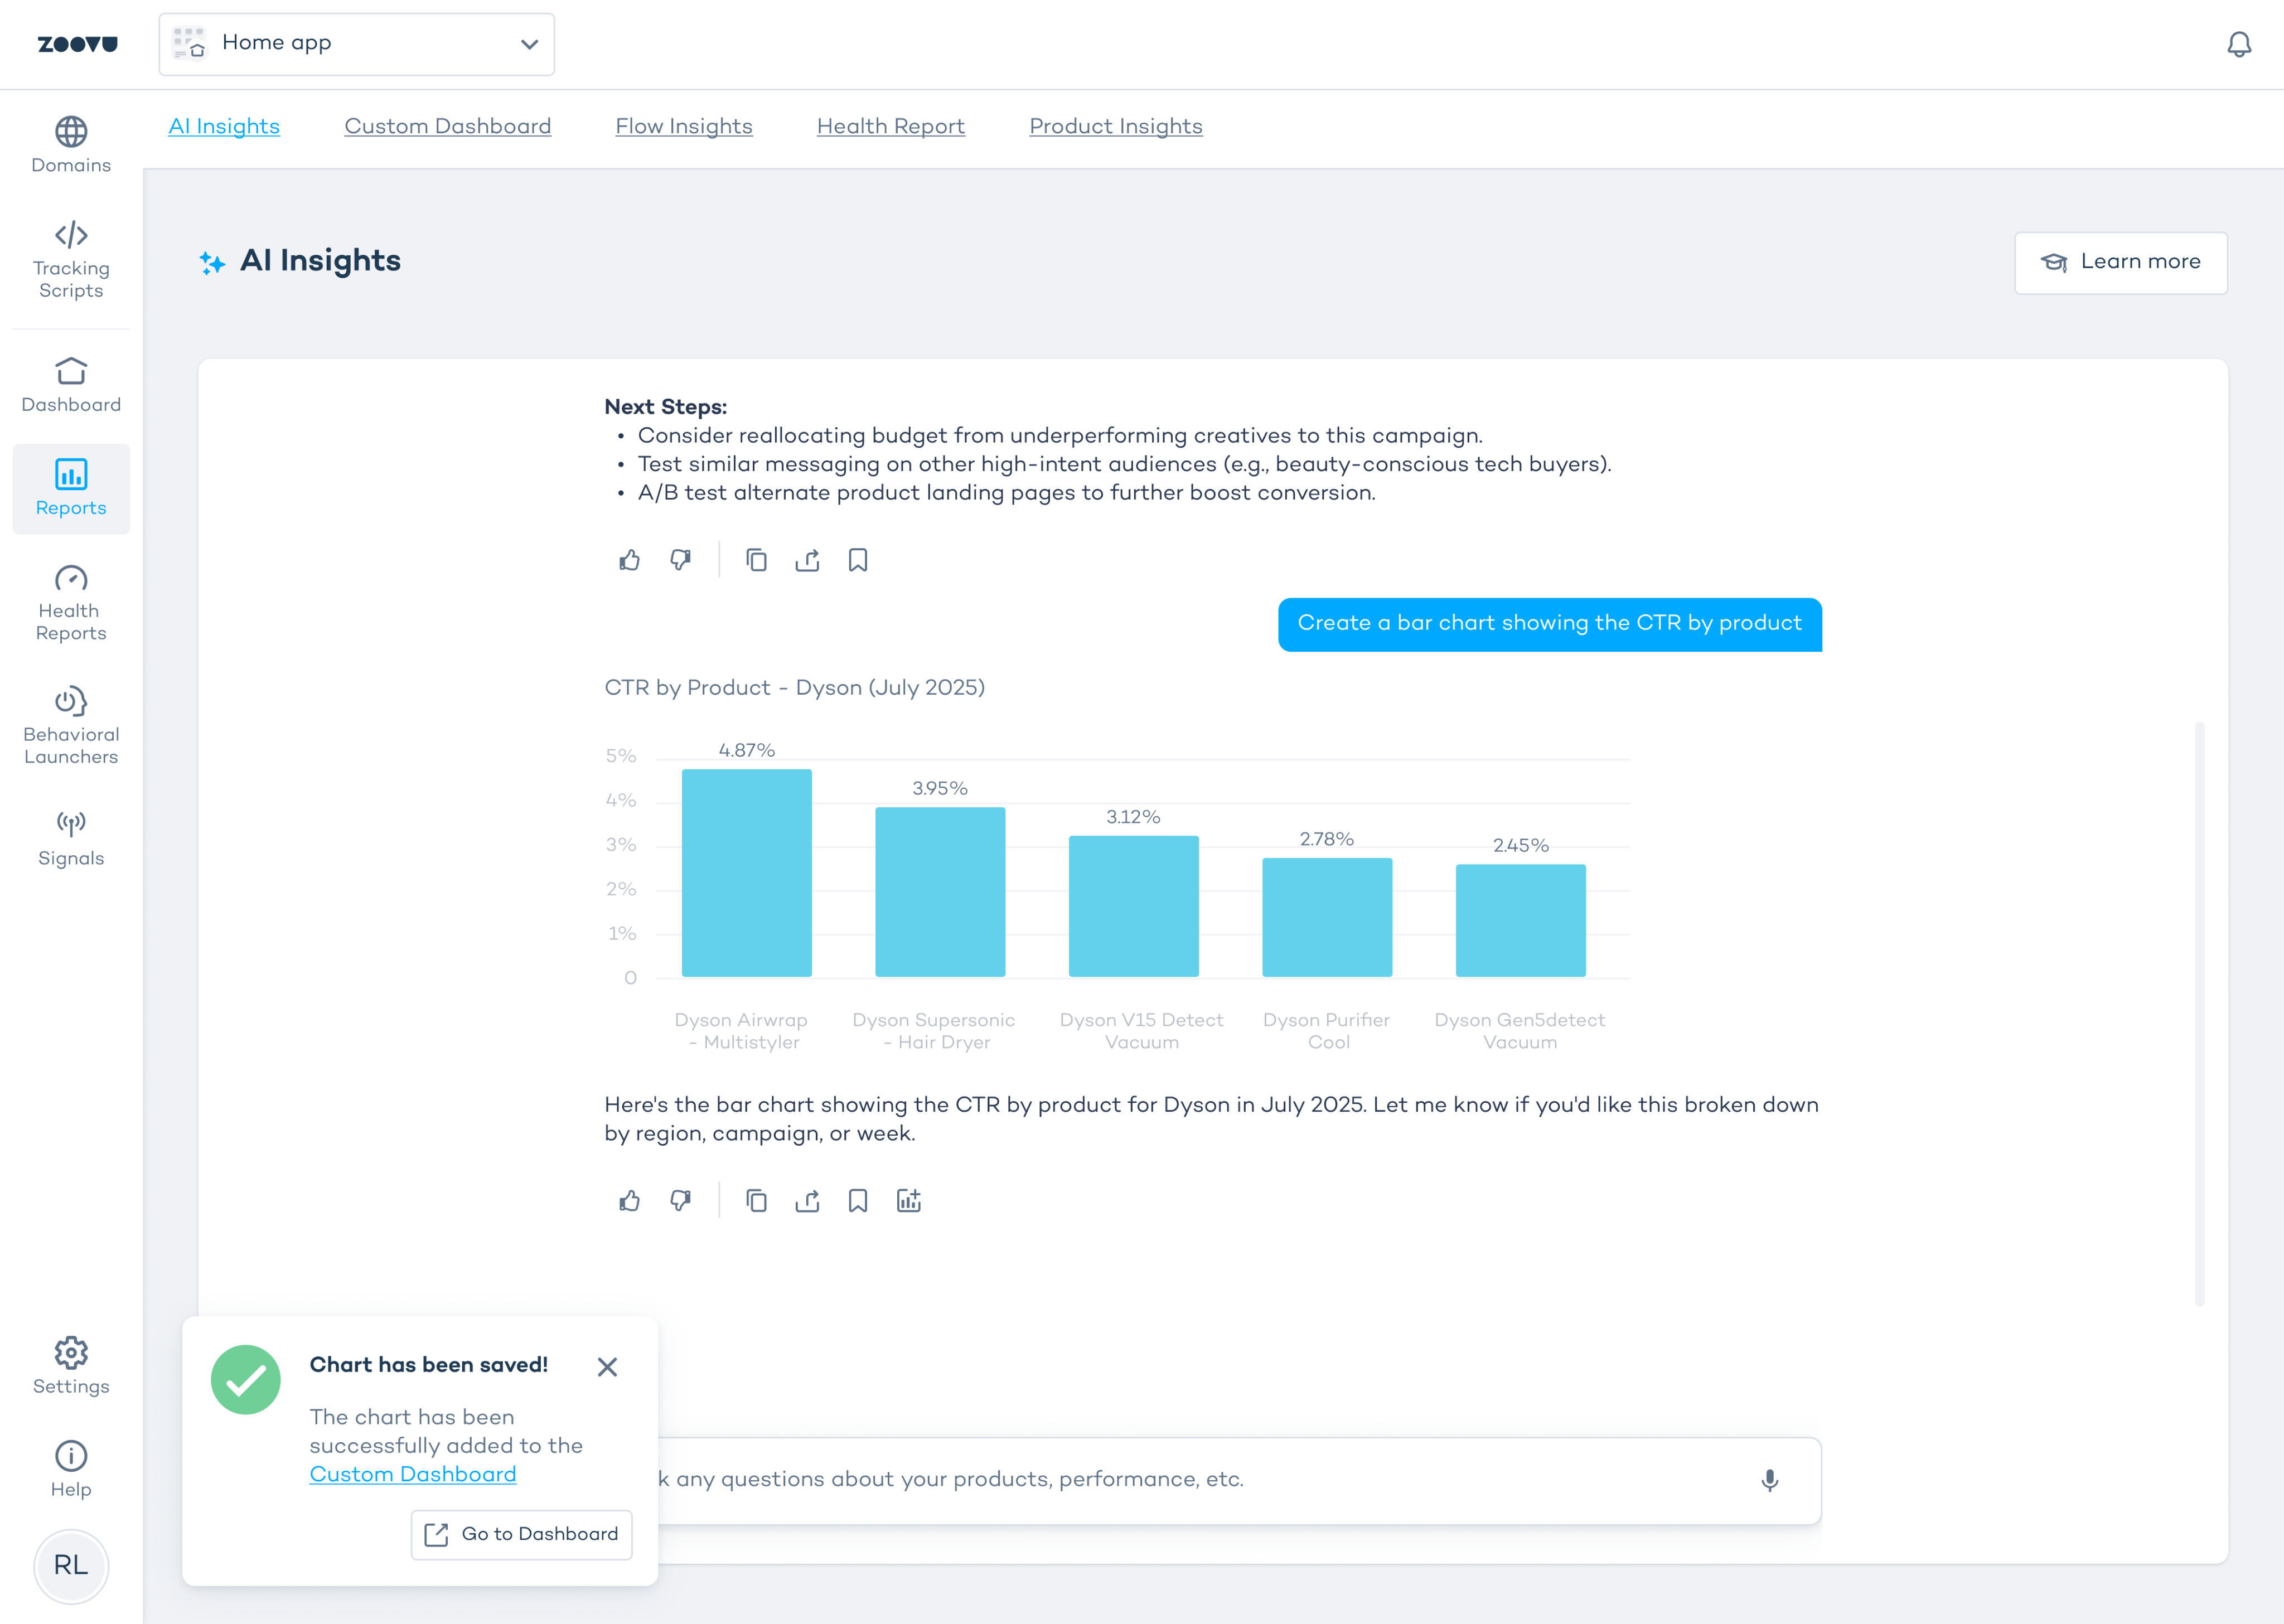
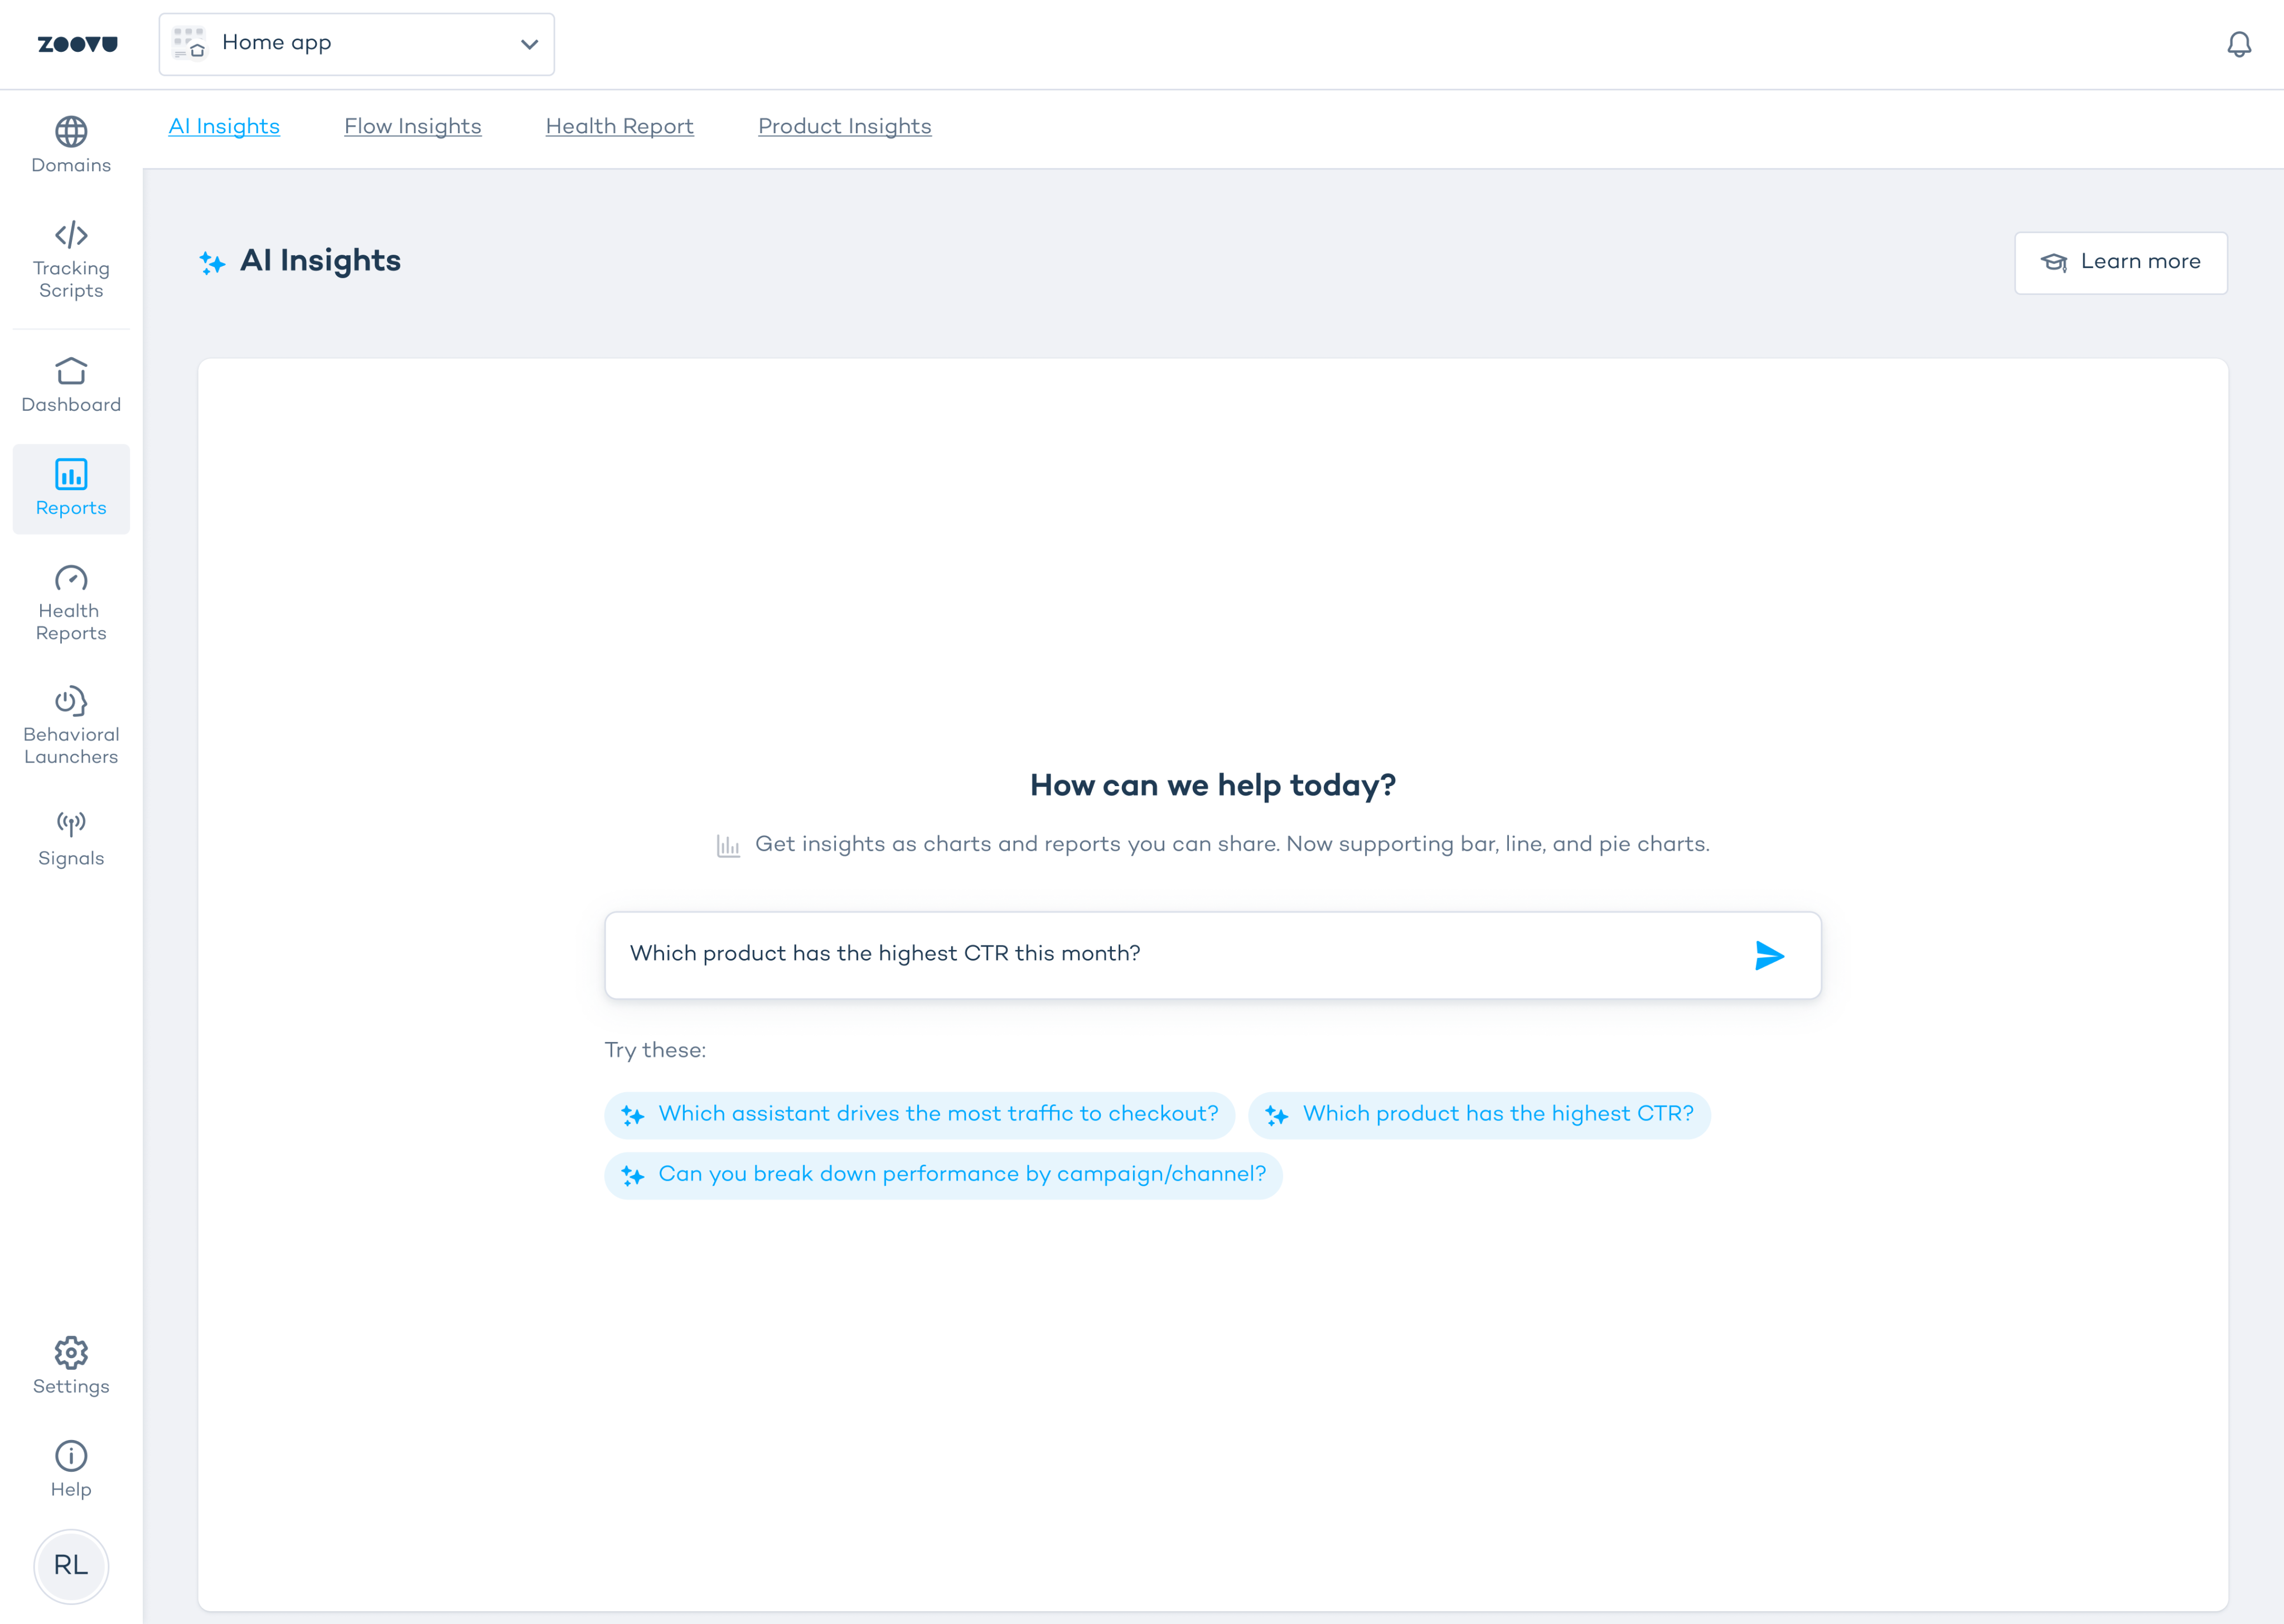
SAMs, TAMs, and marketing managers needed quick answers to questions like "which assistant drives the most traffic to checkout?" The data existed, but the path to it was slow. A conversational interface could compress that from hours to seconds.
Solution
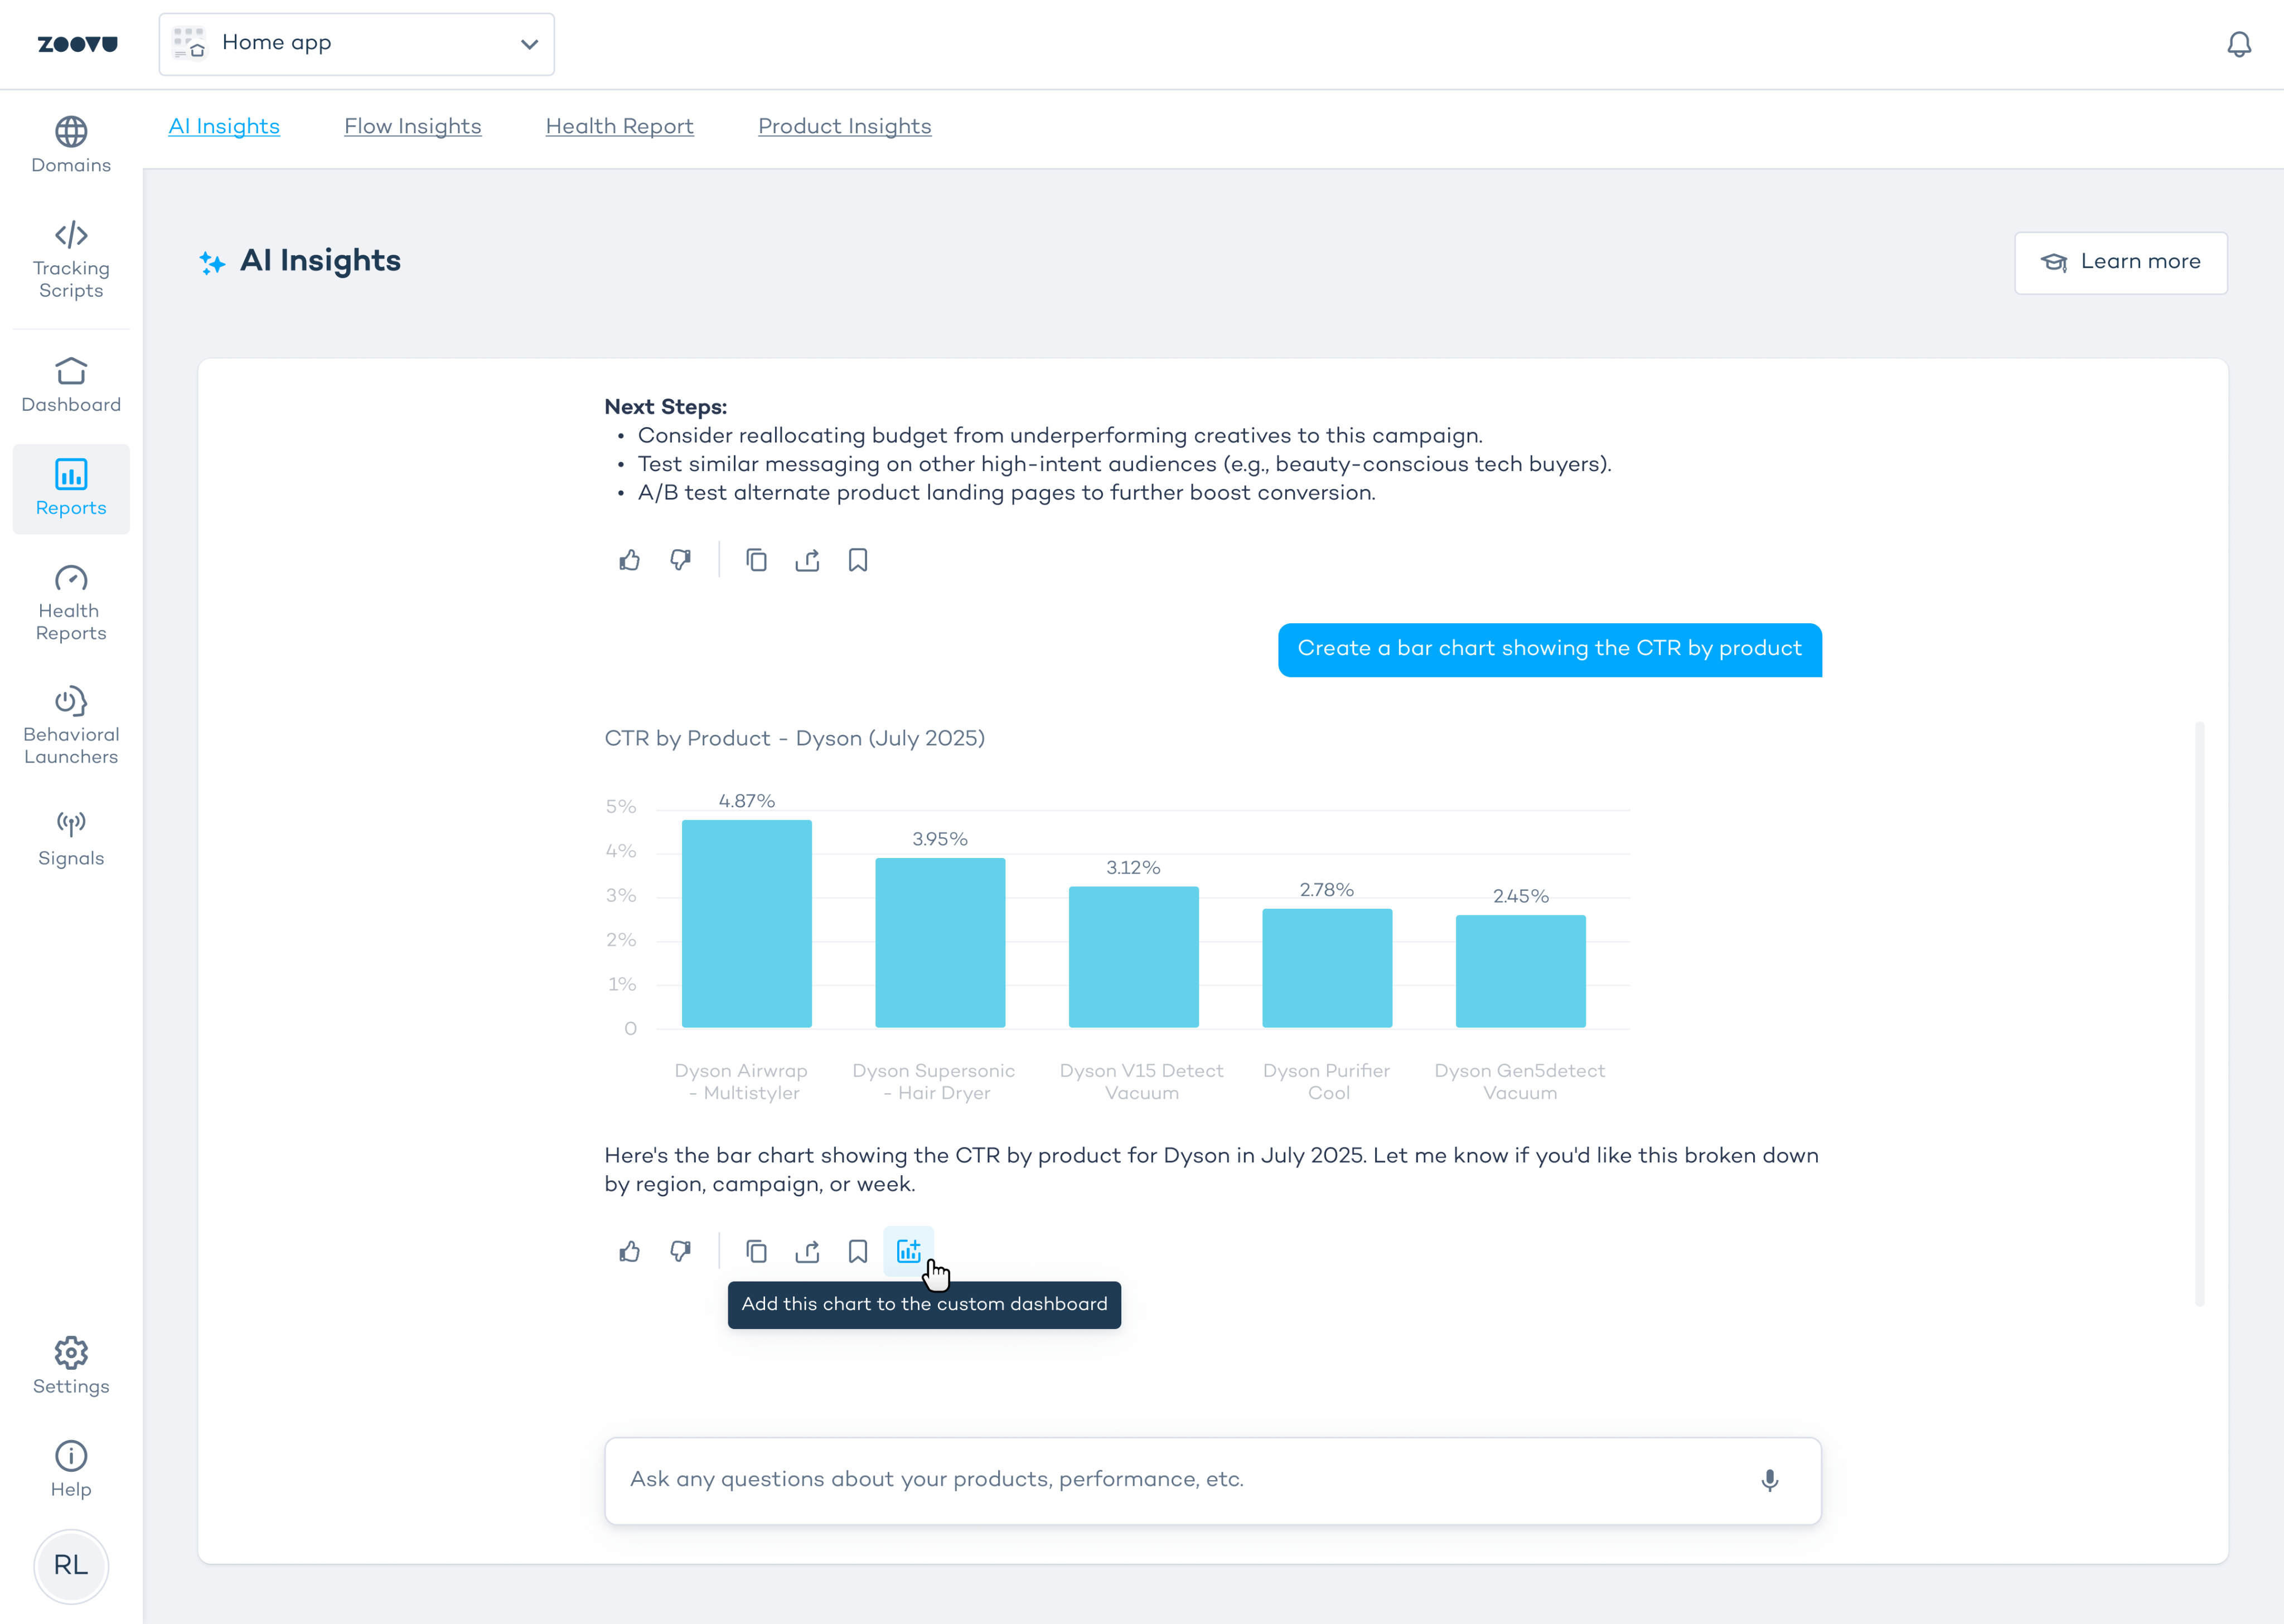
Chart generation & dashboard pinning
Rebuilt the entire plugin visually: search bar, filters, result cards, navigation, quick view, product detail page, comparison, and guided questions. Both square and round variants, configurable properties, all states.
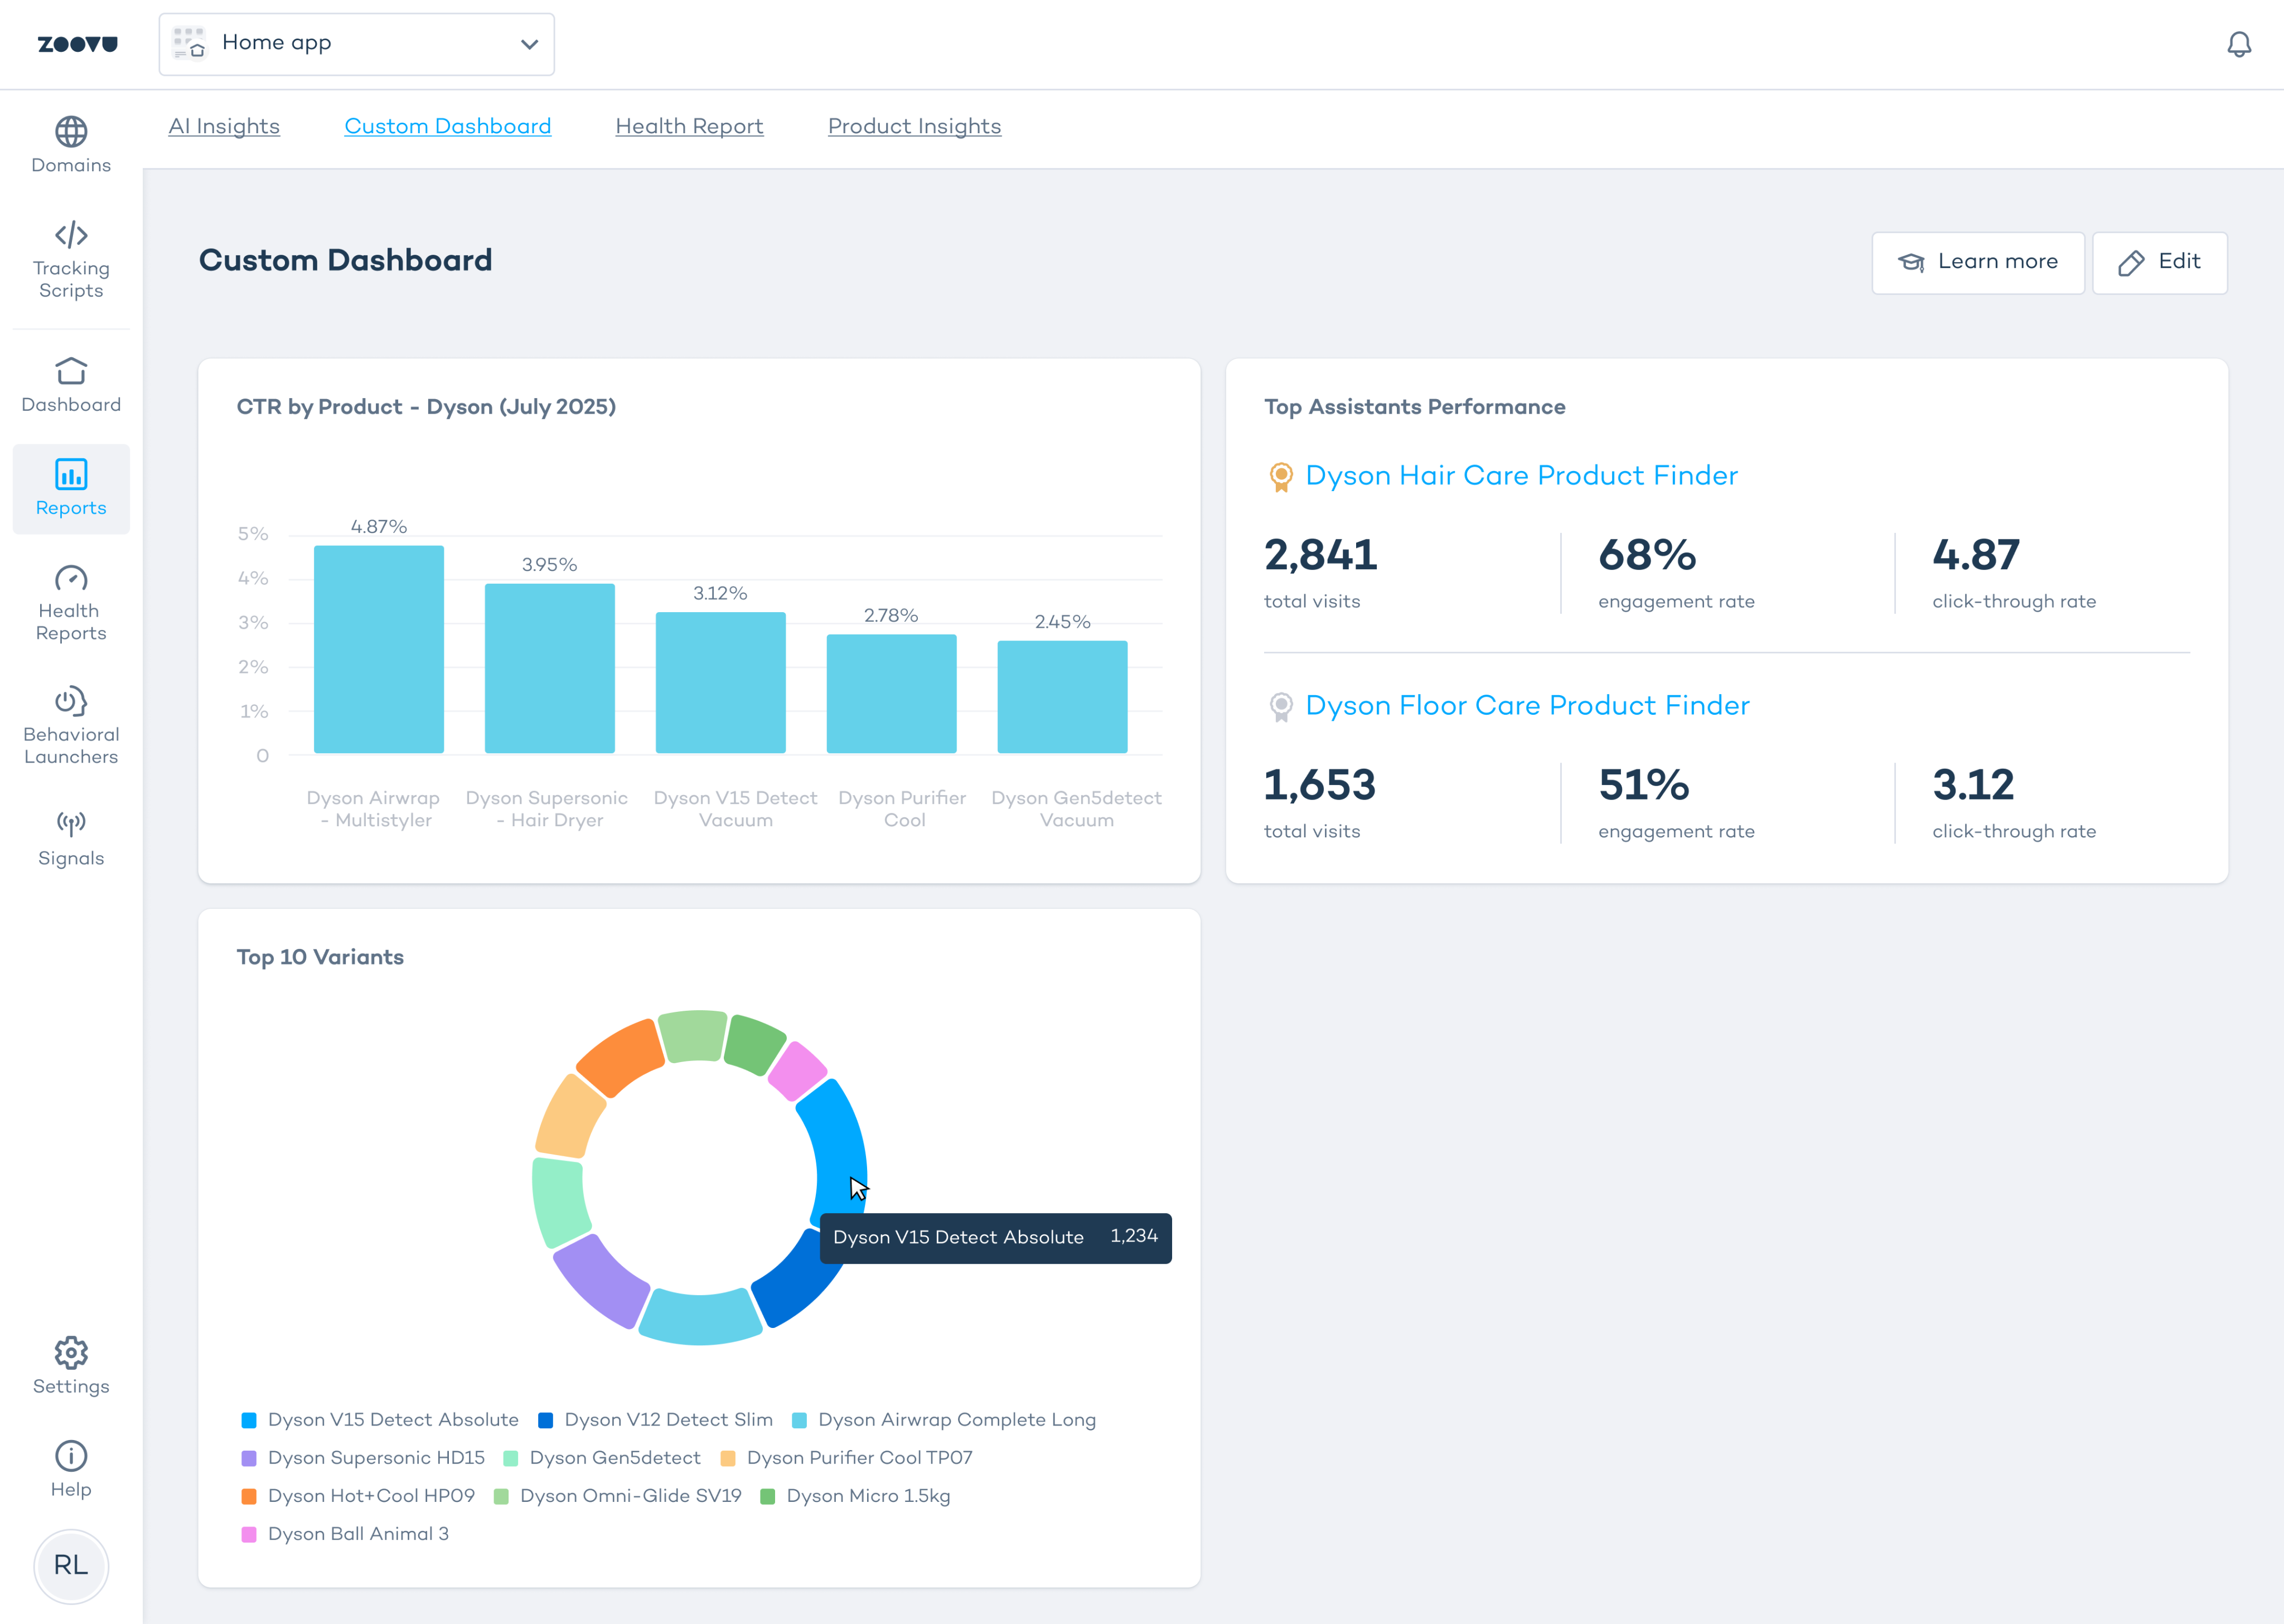
Custom Dashboard
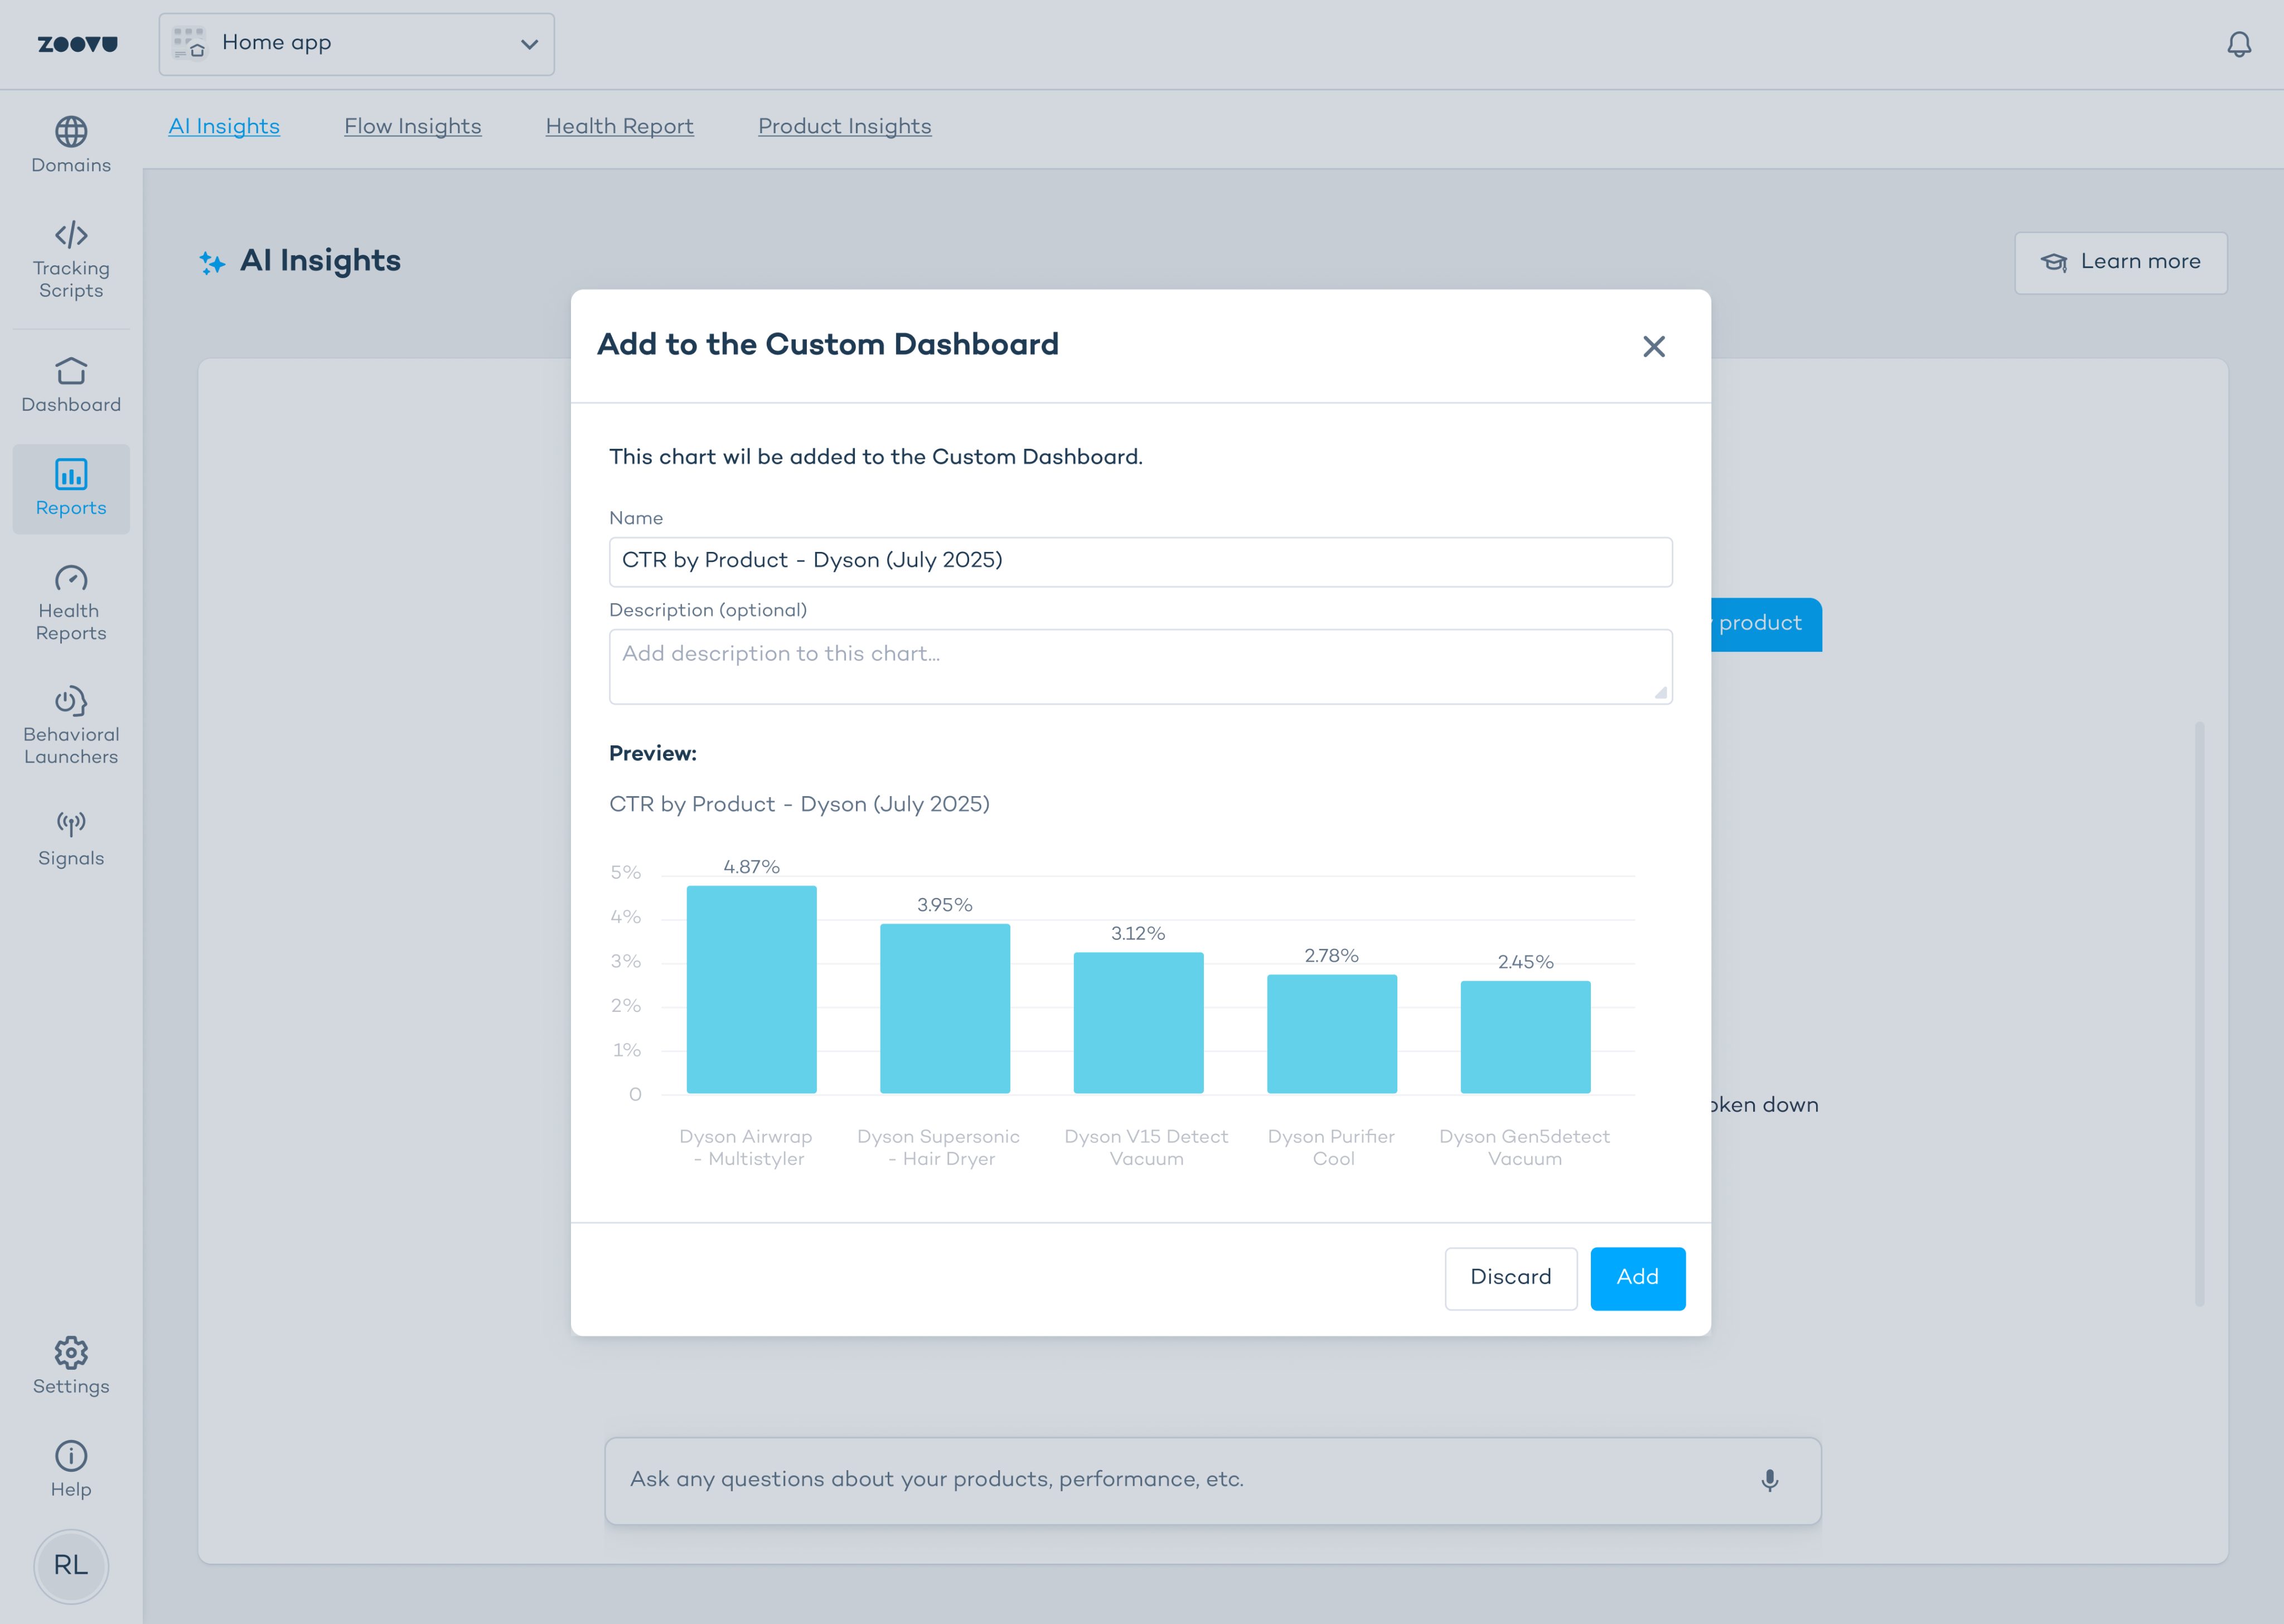
Charts saved from AI Insights populate a persistent Custom Dashboard. Cards are arranged in a flexible grid layout and can be added to over time as new questions are explored.
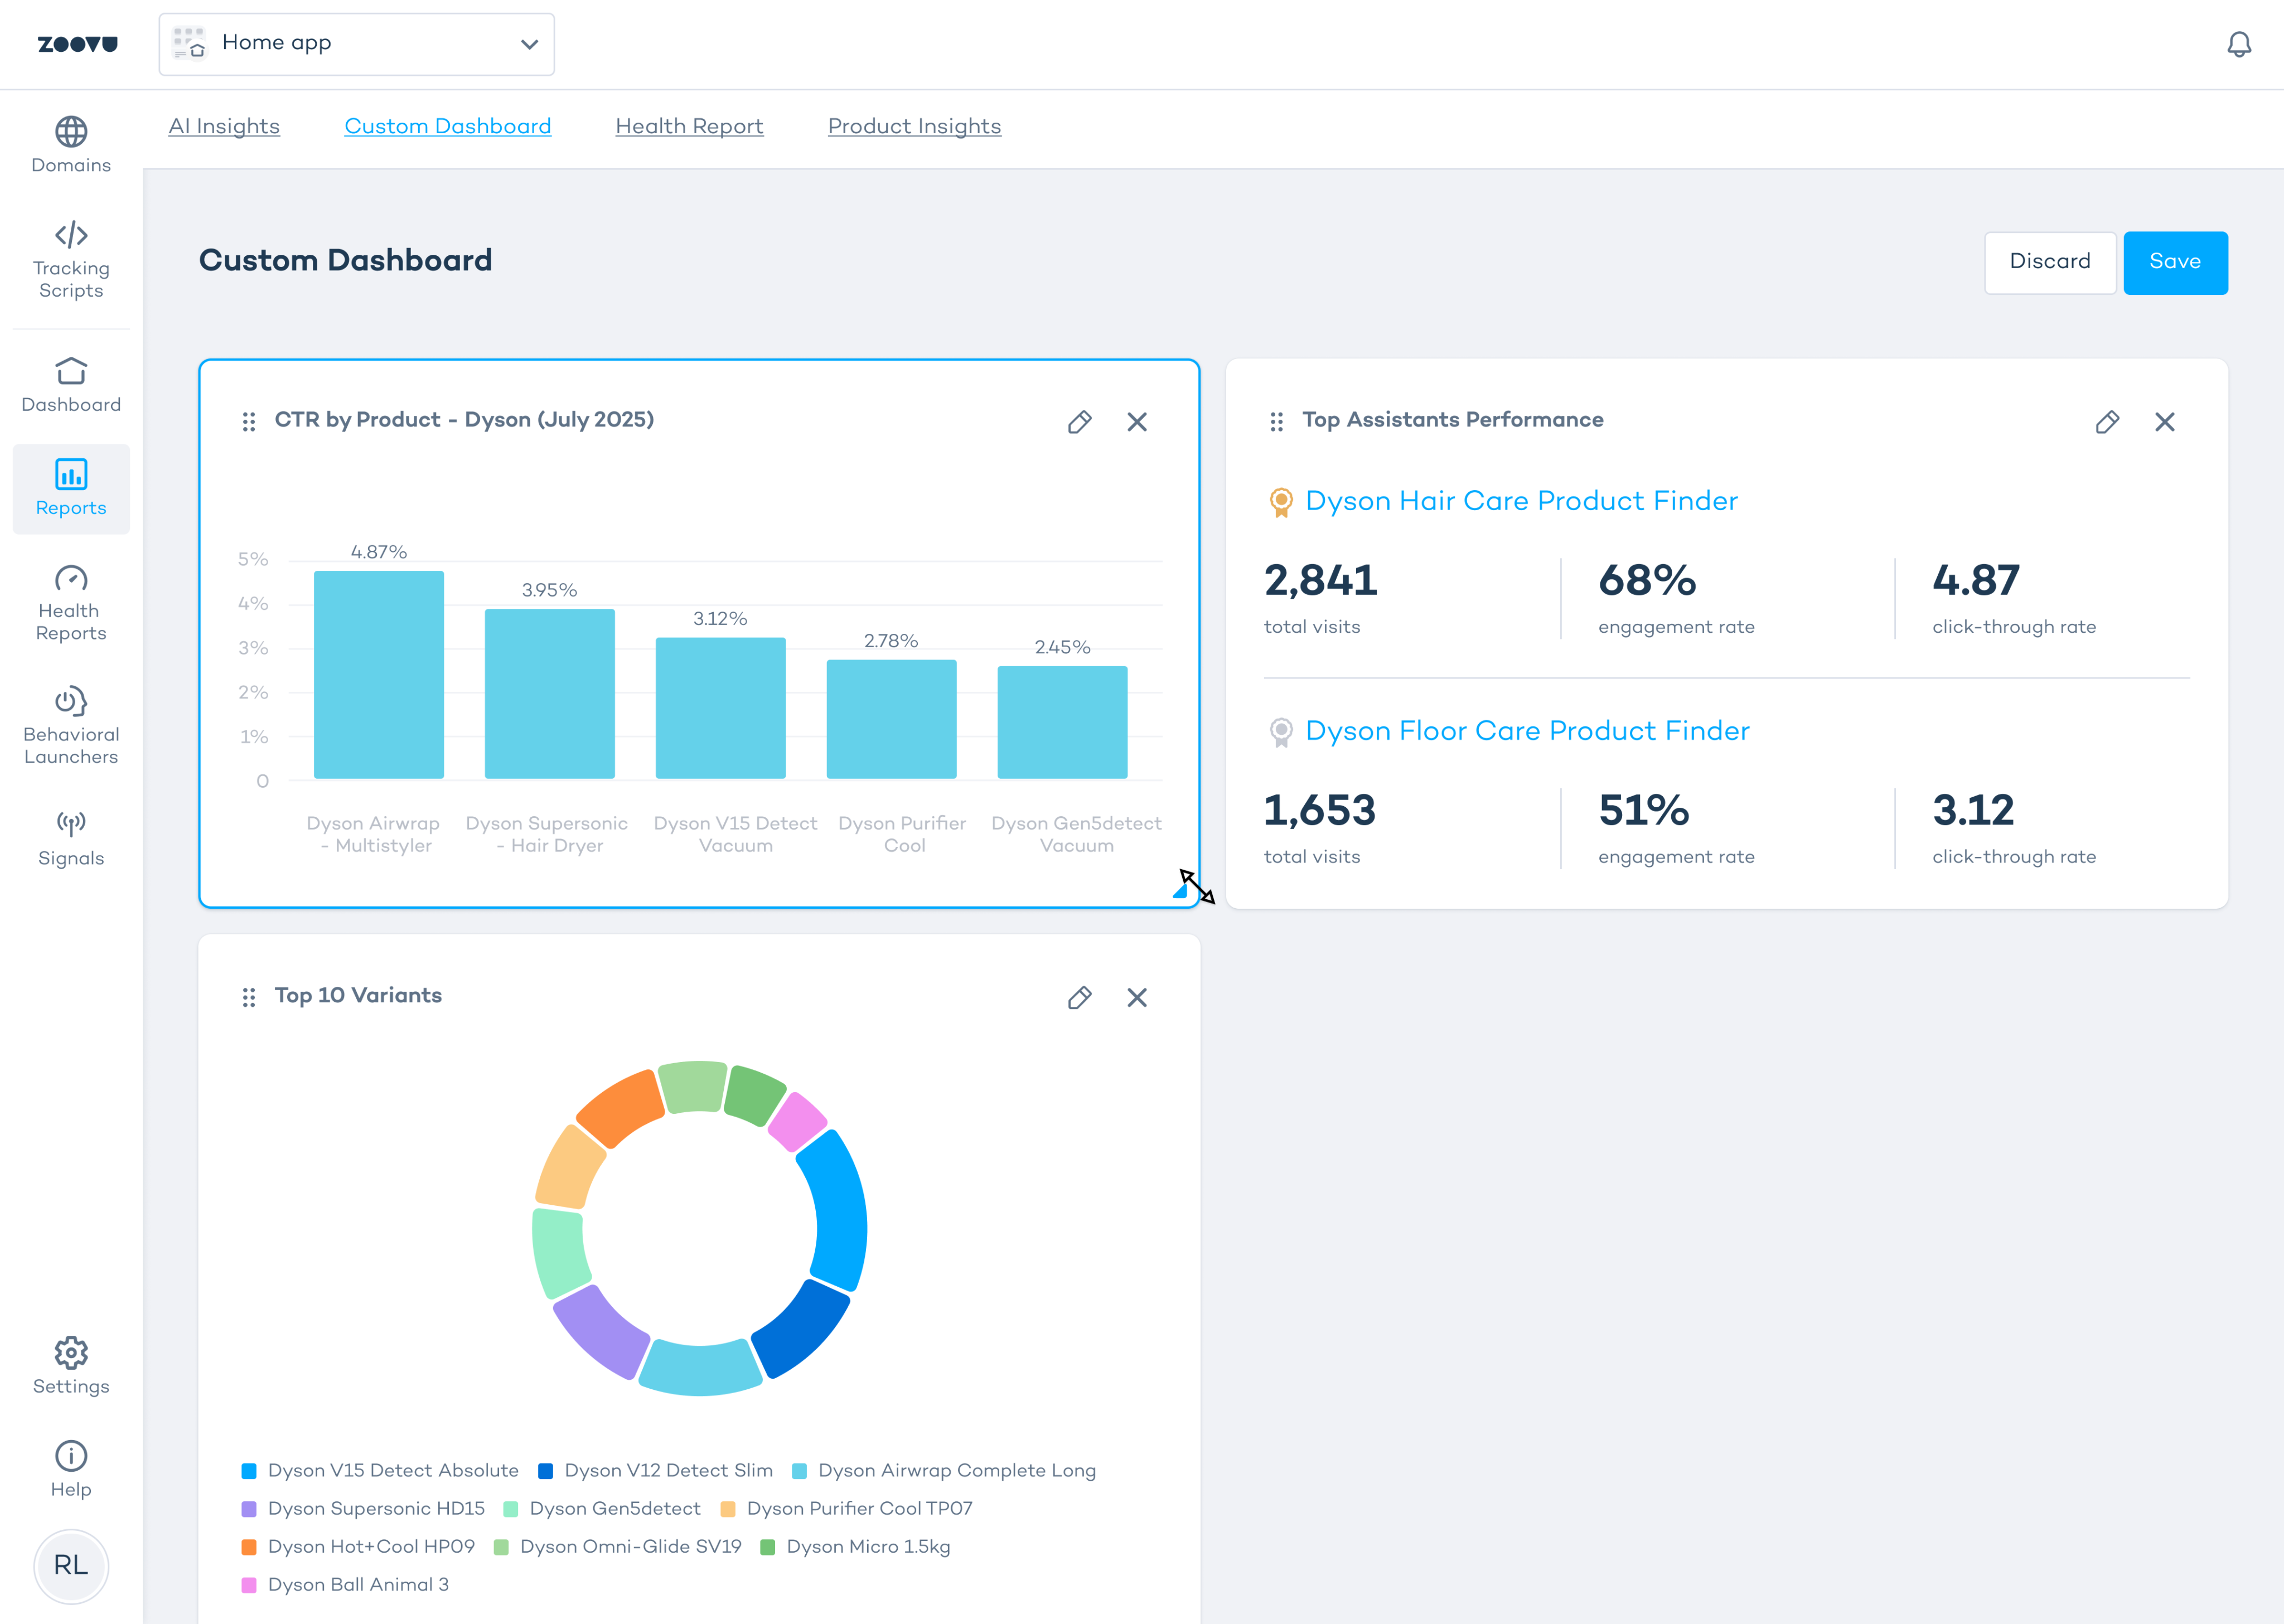
Edit mode
Clicking Edit reveals drag-and-drop controls: cards can be moved, resized, renamed, or removed.
An inline banner explains what's possible, keeping the mode self-explanatory. Changes are confirmed with Save or discarded.

Impact
Zoovu SAM, usability interview

"It not only saves my time, but my colleagues' time as well."
After shipping, internal usability sessions confirmed the core value: AI Insights replaced manual data exports and ad-hoc requests to colleagues for the most common reporting tasks. The feature was especially valued for exploratory analysis and cross-cutting questions that previously required raw data and significant manual effort.


